
DocKit DynamoDB Manage & Metrics - Full Table Control at Your Fingertips
DynamoDB is a powerful, fully-managed NoSQL database — but managing it has always required juggling multiple tools. The AWS Console is browser-based and slow. The AWS CLI demands precise syntax knowledge for every operation. Commercial tools like Dynobase charge monthly subscriptions. DocKit's DynamoDB management and metrics panel gives you a native desktop experience for browsing, managing, and monitoring DynamoDB tables — entirely free.
The Challenge of DynamoDB Management
DynamoDB is designed to scale effortlessly, but operational visibility does not come for free. Teams frequently encounter pain points:
- AWS Console limitations: The web interface is functional but slow, requires constant internet access, and provides limited bulk operation support.
- No desktop-native tool: Until recently, every free DynamoDB management tool has been browser-based or CLI-only.
- Fragmented metrics: Capacity metrics, item counts, and storage data are spread across the DynamoDB console and CloudWatch — requiring multiple browser tabs to get a complete picture.
- No multi-environment workflow: Switching between development, staging, and production accounts in the AWS Console means logging in and out or maintaining multiple browser profiles.
DocKit addresses all of these by offering a unified desktop panel for DynamoDB table management and metrics — running natively on macOS, Windows, and Linux.
What DocKit's DynamoDB Management Panel Covers
The management panel in DocKit provides comprehensive coverage of day-to-day DynamoDB operations:
- Table browsing: See all tables in your account and region at a glance.
- Table details: View table status, creation date, billing mode, and key schema.
- Index management: Inspect Global Secondary Indexes (GSIs) and Local Secondary Indexes (LSIs) without digging through the AWS Console.
- Capacity monitoring: Track provisioned read/write capacity units and on-demand usage metrics.
All of this is available in a single application, with connections to multiple AWS accounts and regions managed from DocKit's sidebar.
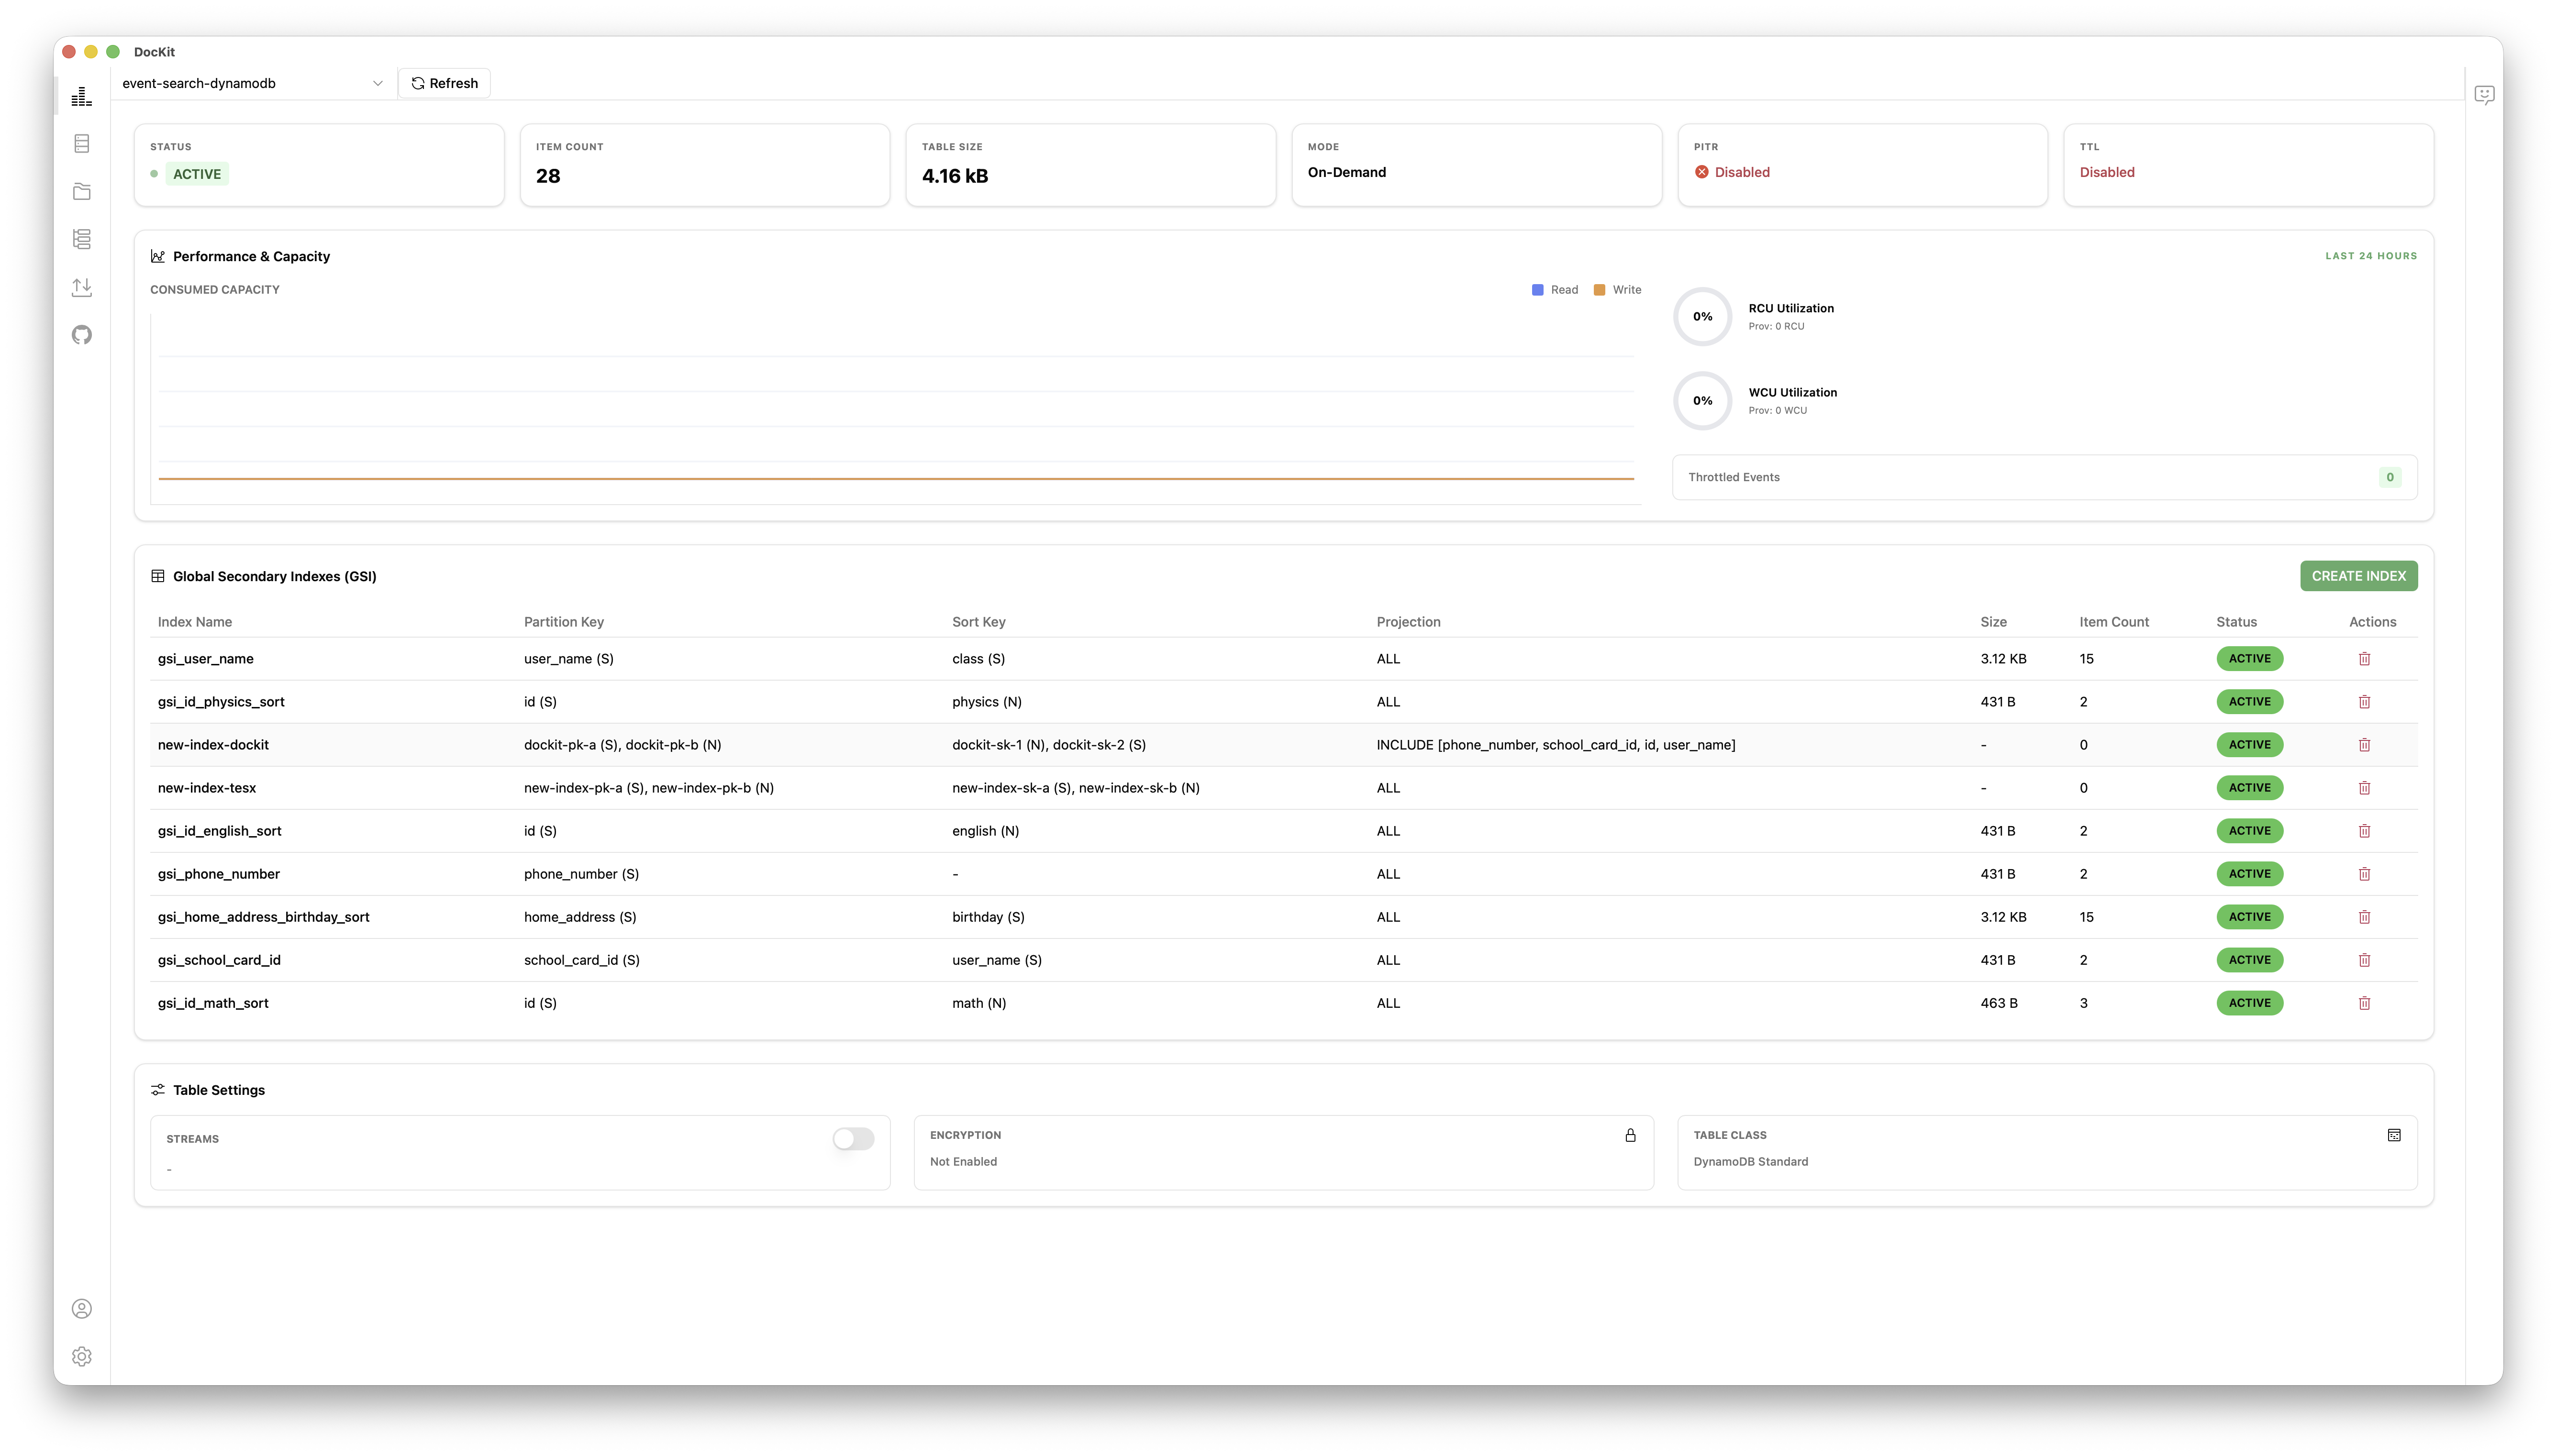
Viewing Table Metrics
Click the Metrics tab within a table view to see real-time operational data for that table:
Item Count and Storage Size
- Item count: The total number of items in the table. Note that this is the DynamoDB-reported estimate, which is updated approximately every 6 hours.
- Table size: Storage consumed by the table in bytes. Useful for tracking growth over time and estimating costs.
Read/Write Capacity
For Provisioned tables:
- Current Read Capacity Units (RCU): the provisioned throughput for reads.
- Current Write Capacity Units (WCU): the provisioned throughput for writes.
- Auto-scaling status: Whether auto-scaling is enabled and the current min/max settings.
For On-Demand tables:
- DocKit shows the table's billing mode and notes that capacity scales automatically.
Capacity Mode
DocKit shows whether a table is in Provisioned or On-Demand (Pay-Per-Request) billing mode. You can also see:
- When the billing mode was last changed.
- Whether the table has auto-scaling policies applied.
Index Management
DynamoDB indexes are critical for query performance, but they are often under-inspected because the AWS Console makes them cumbersome to browse. DocKit's Indexes tab provides a clean overview:
Global Secondary Indexes (GSI)
For each GSI, DocKit shows:
- Index name
- Partition key and sort key (if applicable)
- Projection type: ALL, KEYS_ONLY, or INCLUDE
- Projected attributes (for INCLUDE projection)
- Index status: ACTIVE, CREATING, UPDATING, or DELETING
- Item count and index size (approximate)
- Provisioned throughput (for Provisioned billing mode tables)
Local Secondary Indexes (LSI)
LSIs are shown similarly, with their partition key (same as the table's partition key), sort key, and projection details.
Having index information alongside table data in one view eliminates the context-switching between DynamoDB console tabs that developers typically experience.
DocKit vs. AWS Console for DynamoDB Management
| Capability | DocKit | AWS Console |
|---|---|---|
| Platform | Desktop (Mac/Win/Linux) | Web browser |
| Multi-account | ✅ Sidebar switching | ❌ Login/logout |
| Table browsing | ✅ Fast, filterable | ✅ Slower, paginated |
| View item count | ✅ | ✅ |
| View storage size | ✅ | ✅ |
| View GSI/LSI details | ✅ One-click | ✅ Buried in tabs |
| Capacity metrics | ✅ | ✅ (+ CloudWatch) |
| Works offline | ✅ (DynamoDB Local) | ❌ |
| Price | Free | Free |
| Open source | ✅ | ❌ |
Connecting to Multiple AWS Accounts
DocKit supports managing DynamoDB across multiple AWS accounts and regions simultaneously. From the connection manager, you can configure:
- Access Key + Secret: Enter credentials directly for service accounts.
- Region: Select any AWS region where DynamoDB is available.
- DynamoDB Local: Connect to a locally running DynamoDB instance for development.
Each configured connection appears in the sidebar. Switch between production, staging, and local environments with a single click — no browser logins required.
Getting Started
Ready to take full control of your DynamoDB tables?
- Download DocKit — Available free for macOS, Windows, and Linux.
- Follow the Connect to Server guide to configure your DynamoDB connection.
- Open the DynamoDB Manage & Metrics panel to start browsing tables and monitoring metrics.
- Check the full DynamoDB Manage & Metrics documentation for a complete reference.
DocKit is 100% free and open-source (Apache 2.0). No subscriptions, no feature limitations, no data leaving your desktop. Download it today and experience professional-grade DynamoDB management without the cost.